About Those “Driving While Black” Statistics...
Written for Bacon’s Rebellion by James A. Bacon
When the Commonwealth published its Virginia Community Policing Act traffic-stop database last week, the Richmond Times-Dispatch spun the data this way:
Black drivers are disproportionately stopped and arrested, and they have their cars searched at higher rates than any other race statewide.
Here’s what the RTD could have written:
Black drivers stopped for traffic violations were disproportionately likely to be let go with warnings — or subject to no law enforcement actions at all.
Any fair-minded story would have provided both conclusions and conveyed the complexities and uncertainties in analyzing the data. Instead, the newspaper settled for cherry picking data that supports its ongoing Oppression Narrative. The reporters did not come right out and say that the statistical disparities are attributable to “racism” or “discrimination,” but the implication is clear enough. In contemporary society, statistical disparities are widely deemed to constitute proof.
Before I delve into the data, which covers the year from July 2020 to June 2021, let me be clear about one thing: I am not ruling out racism and/or discrimination as contributing factors to the disproportionate stopping of African-Americans on Virginia roads and highways. Discrimination may be a factor in some jurisdictions, or among some law enforcement personnel. I don’t pre-judge. I await a sober analysis of the data. I am saying that the RTD analysis is methodologically biased, and it recklessly feeds racial grievances and resentments.
Traffic stops and age. Let us start with two indisputable facts:
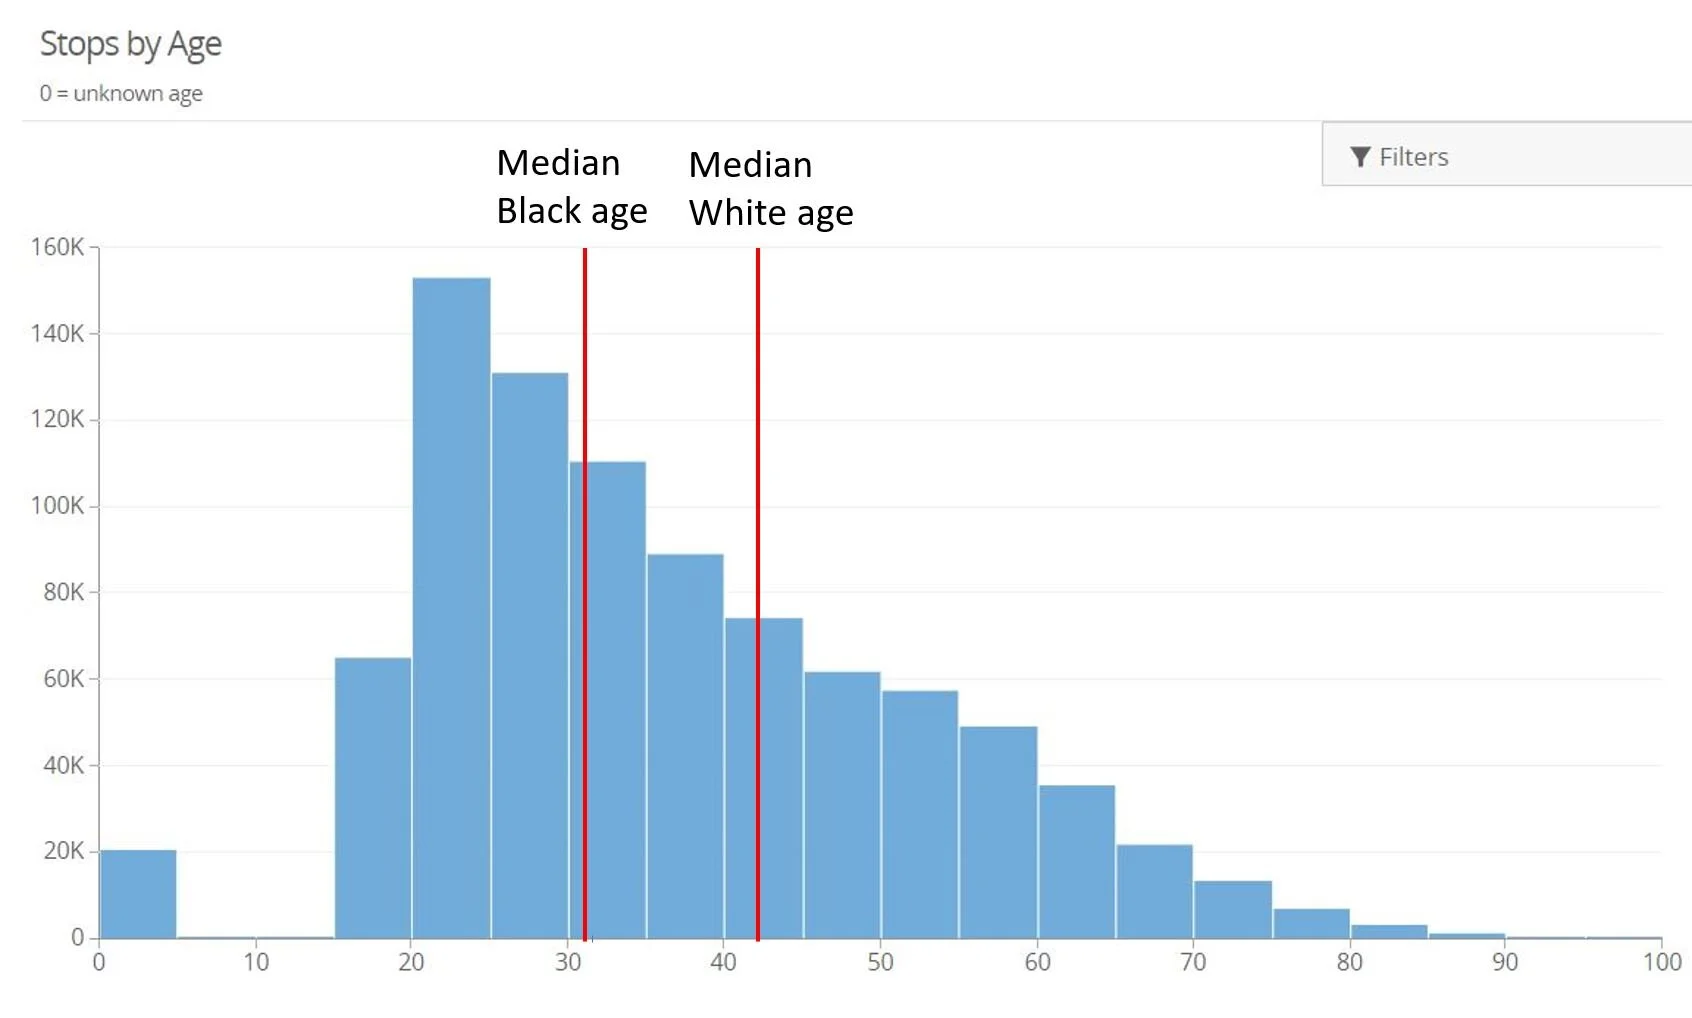
There is a powerful correlation between age and the likelihood of being pulled for a traffic violation.
The median age of White people in the United States is 44, compared to the 32-year-old median age of Black people.
All other things being equal, because Black motorists are on average younger than White motorists, one would expect Black motorists to commit more driving infractions and, hence, to be stopped at a “disproportionate” rate.
This graph, taken from the state traffic-stop database, shows the distribution of traffic stops by age. I have superimposed red lines showing the median age of White and Black populations in Virginia. Without accounting for that age differential, comparisons between the frequency of Black and White traffic interactions with law enforcement is incomplete and almost meaningless.
Race/ethnicity and behavior. Viewing racial disparities in traffic-stop rates through the prism of law-enforcement racism ignores the possibility that traffic stops might reflect the behavior of drivers, not the police. The database tells us that males are far more likely than females to be stopped — 63% compared to 37%. Are males being discriminated against, or are they more aggressive drivers more likely to attract law-enforcement attention?
Are college graduates more or less likely to violate traffic laws than high school dropouts? Are high-income drivers more or less likely than low-income drivers? Law enforcement does not collect data that allows us to answer those questions. But insofar as education and income are correlated with race, those factors might account for racial differences in traffic stops. Assuming that racial discrimination is the only possible explanation is irresponsible.
Racial/ethnic sub-cultures also may play a role. For example, Asian/Pacific Islanders were stopped only 11,100 times last year — accounting for fewer than 2% of all stops, despite the fact that Asian/PIs comprise 5.6% of Virginia’s population. Should we assume, based on this disparity, that police officers discriminate in favor of Asians? Or are Asians just less likely to violate traffic laws?
Results of stops. It is commonly said that police are more likely to target Blacks for moving violations. I have shown in a previous post that it is all but impossible in most instances to ascertain the race of a driver from a stationary position on the side of the road. If police engage in racial discrimination, either consciously or unconsciously, such behavior will occur after traffic stops are made and the driver’s race identified. In other words, if racial profiling or discrimination is a factor, it will manifest itself in more punitive outcomes.
According to the Community Police Act Data Collection database, 84% of all stops were for traffic violations. The outcomes of those stops can be broken down as follows (in order of leniency to severity):
no enforcement action
warning
citations/summons
vehicles searched during a stop
arrest
Blacks comprise 20% of Virginia’s population but 30% of all moving traffic violations. If racial discrimination were at play, we would expect Blacks to account for lower percentages of the lenient outcomes (no action, warnings) and higher rates for the punitive outcomes (citations, searches, arrests).
That’s not what we find. To the contrary, Blacks account for 41% of all “no enforcement actions,” and 32% of all warnings. In other words, Blacks were slightly more likely than Whites to be let off the hook. Is it possible that police are bending over backwards to not discriminate?
Blacks accounted for 29% of those given tickets, marginally less than their 30% proportion of all traffic violations; 31% of all vehicles were searched during a stop, marginally higher.
The only comparison in which Blacks fared negatively by a meaningful number were for arrests, a category that comprised a tiny sliver of total traffic encounters. Statewide, police made 16,503 arrests in 2020-21. Of those arrested 37% were Black.
One possible explanation is that police were more likely to approach Black motorists expecting trouble, thus leading to misunderstandings, escalations and confrontations. Another possible explanation is that Blacks, influenced by popular media reports of “driving while black,” are more likely to respond defensively, thus provoking more aggressive police responses. Perhaps both explanations are at work.
The differential arrest rate is a matter for concern and warrants a closer look. But superficial analyses like that offered by the RTD are no help whatsoever. Indeed, they do a disservice to all Virginians.


